

来源:网络 作者:Roman Kamushken
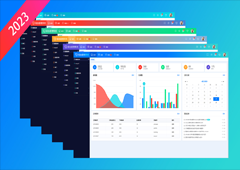
Charts UI kit for Figma
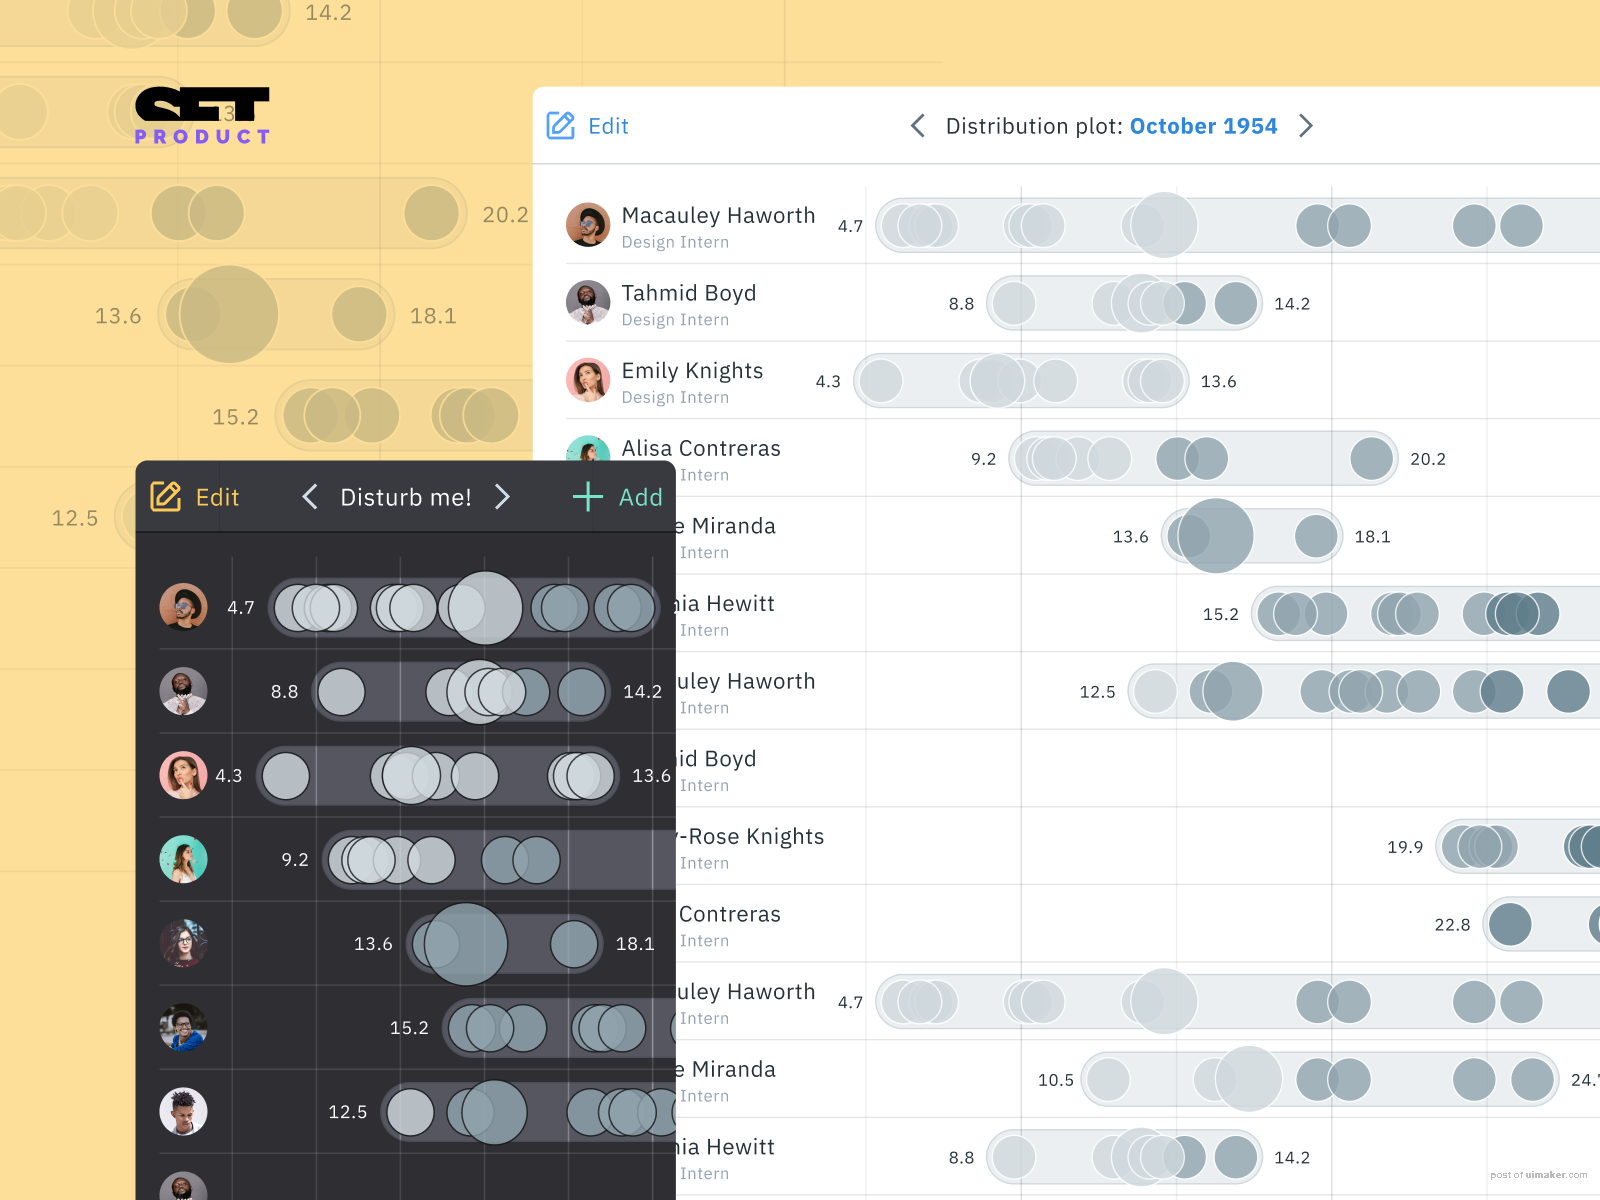
The distribution plot is intended to compare the range and distribution for groups of numerical information
Figma charts library made of components. Contains most common data visualization patterns from simple bar charts to complicated heatmaps and financial candlesticks. Fits for infographics, dashboards, presentations, visualizations or any other type of data-design projects.
,PNG素材,UI怎么学